Design Ops Handbook/Chapter 06 of 06
Metrics & Reporting
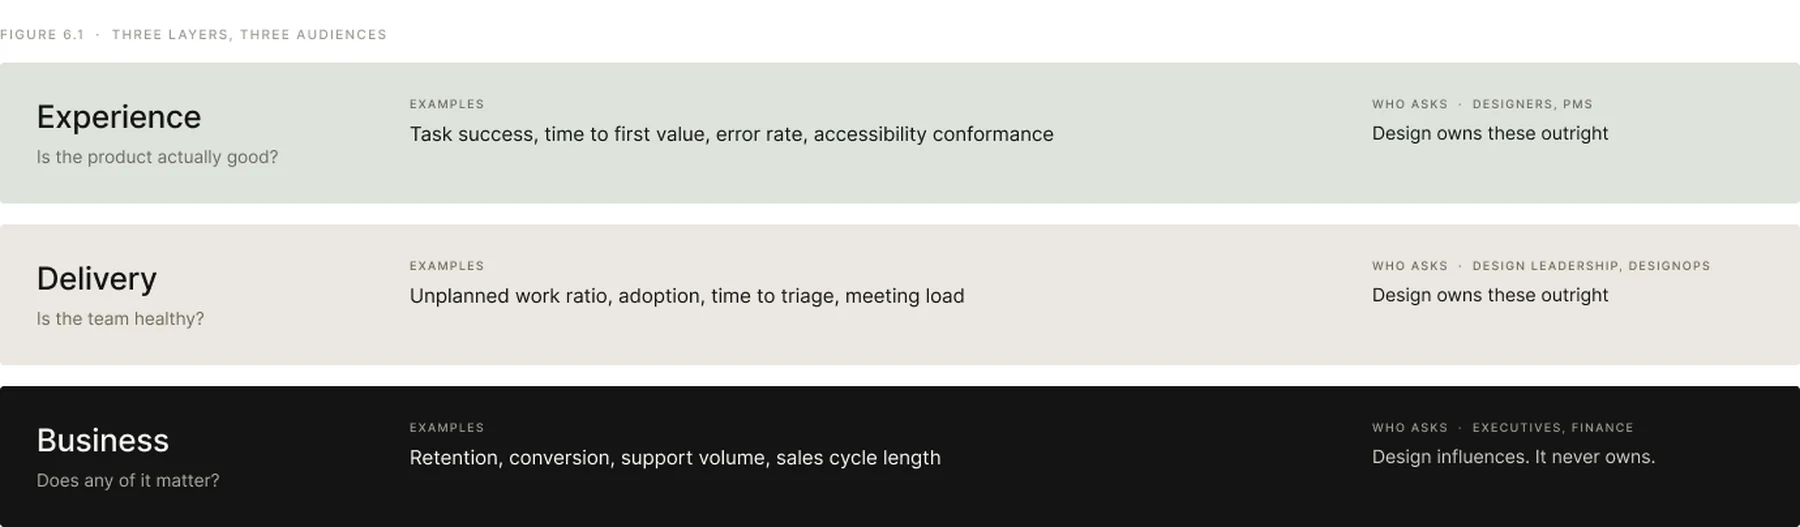
Design metrics fail when they are built to prove that design was worth it. They work when they answer a question leadership was already asking. This chapter is about the difference.
Section 01
Stop Proving Value
A dashboard built to justify the team’s existence gets read once. A dashboard that answers the question your CFO asked last week gets read every month. Same numbers, different framing, completely different outcome.
Section 02
The Metric Tree
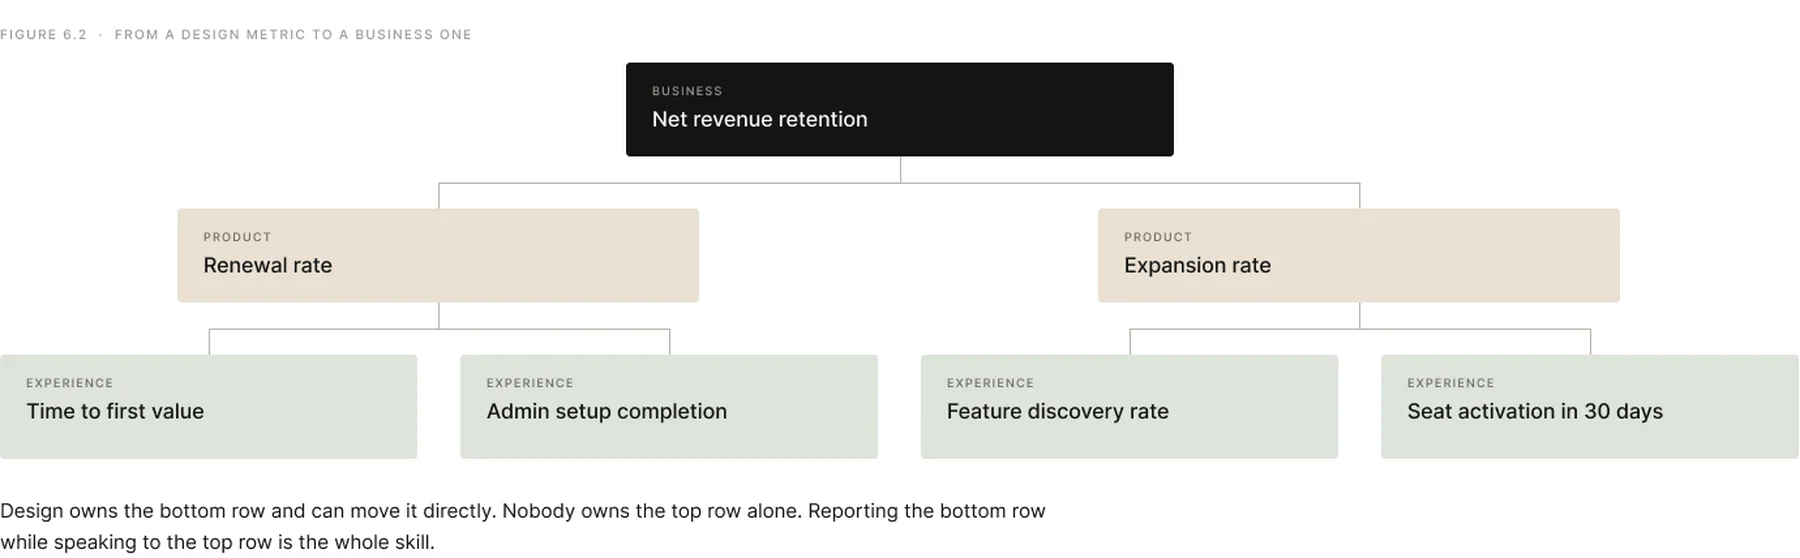
The tree is how you avoid both failure modes at once. You report the bottom row because it is yours. You talk about the top row because that is the one being asked about. The middle row is the argument that connects them.
Section 03
What To Measure
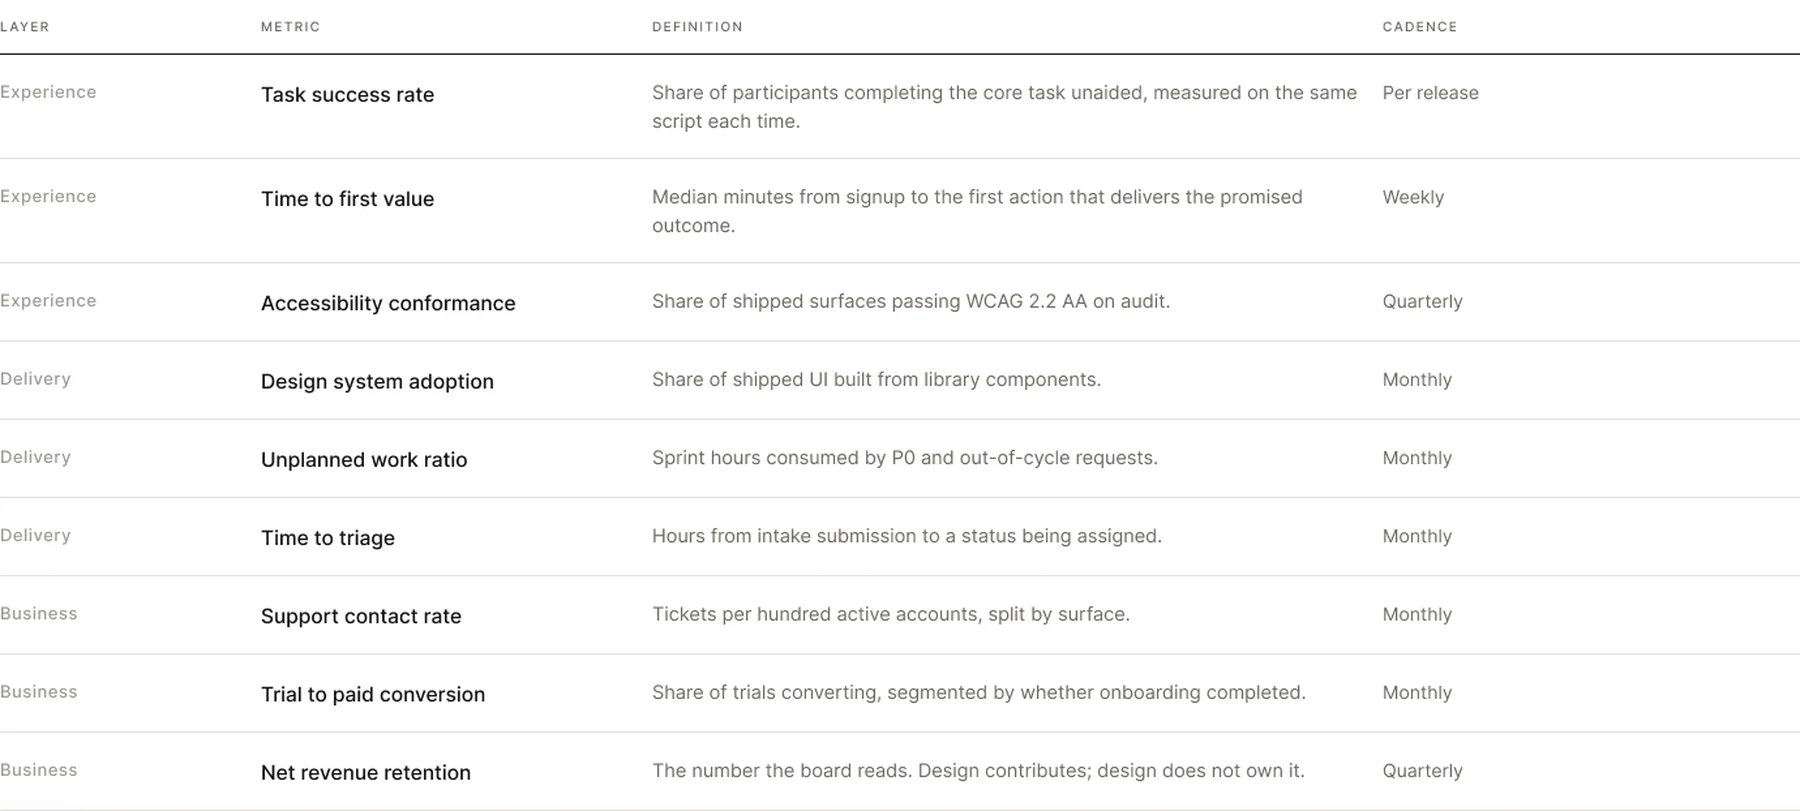
Nine metrics, not ninety. If a number has not changed a decision in two quarters, stop collecting it and say so in the report.
Section 04
The Reporting Rhythm
Three audiences on three clocks, and the mistake is sending all of them the same artefact. An executive does not want the weekly, and a squad cannot act on the quarterly.

Section 05
The Quarterly One-Pager
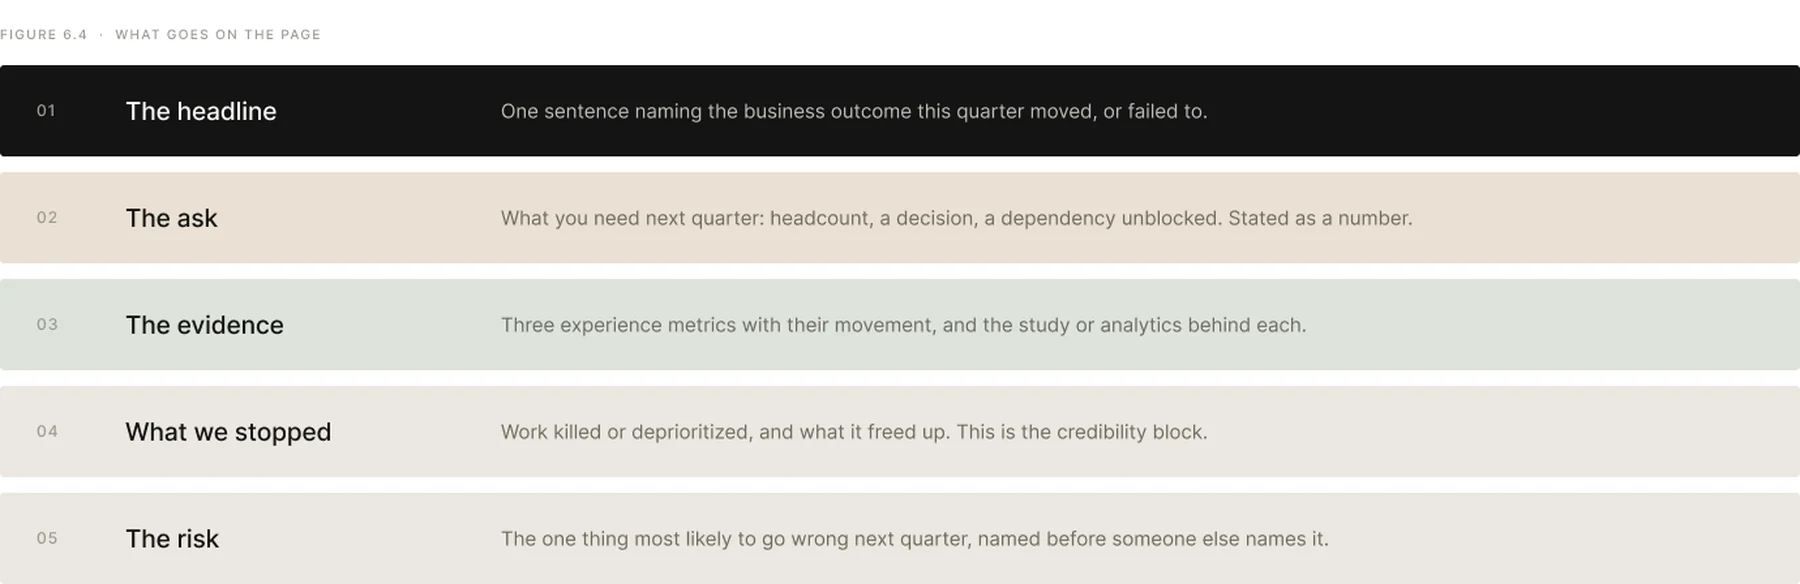
One page, five blocks, in this order. The order matters: the ask goes near the top, while people are still reading, not at the bottom after the charts.
Section 06
What Not To Measure
Each of these is easy to count, which is exactly why teams reach for them. None of them tells anyone whether the product got better, and reporting them trains leadership to see design as activity rather than outcome.
